— Proceso documentado

Cuatro etapas. Cada señal medida y registrada.

Desde la instalación del sensor hasta la alerta en su bandeja de entrada: un método repetible, auditado en campo, sin pasos ocultos.

Extreme close-up of a vibration sensor being bolted onto a rotating shaft housing in a factory, technician's gloved hands tightening the mount, hard fluorescent workshop light, metal surface textured with grease and wear
Close-up of a data acquisition unit panel showing real-time waveform readings on a small monochrome display, mounted on a steel cabinet wall inside a loud industrial plant, hard overhead light casting sharp instrument shadows
Technician's hands holding a printed maintenance report with annotated trend graphs and circled anomaly readings, resting on a metal workbench under fluorescent shop lighting, clipboard and pen visible beside the document
Wide shot of a plant floor monitoring station at night, a single screen showing a red-highlighted alert line within a trend graph, operator seated with back to camera reviewing the readout, dim ambient light from surrounding machinery
/ Método de campo

De la instalación a la alerta

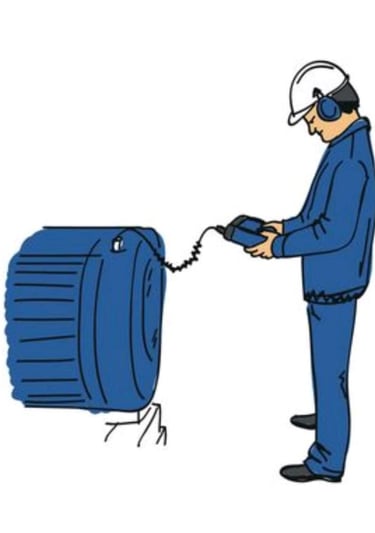
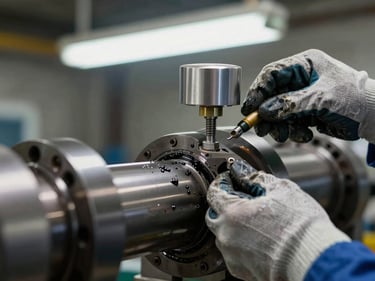
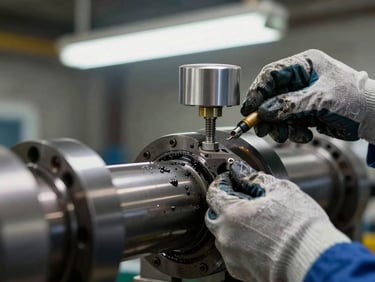
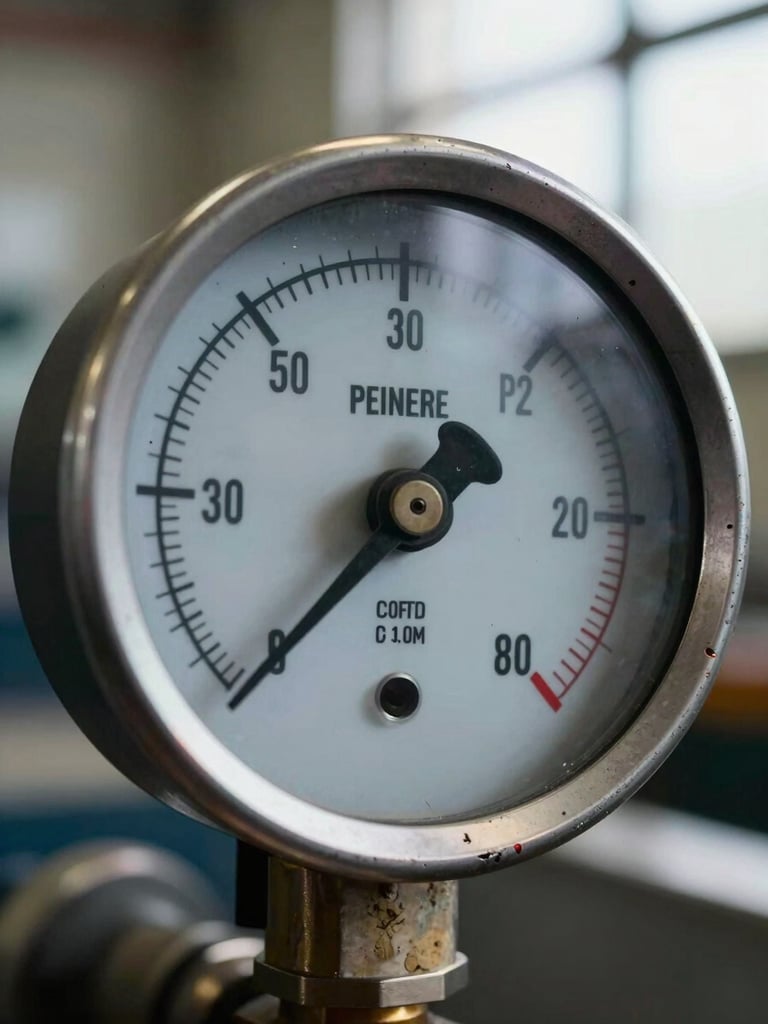
01 — Instalación de sensores

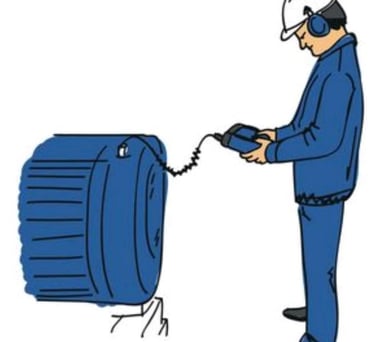
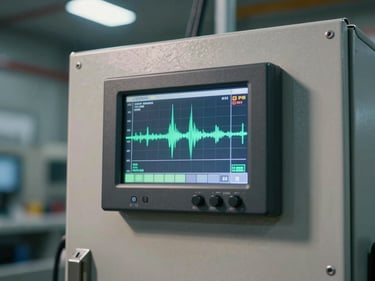
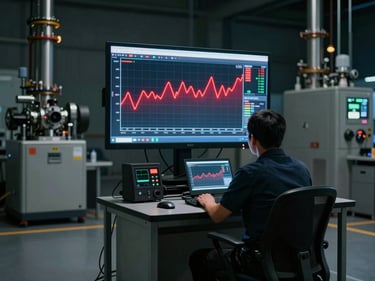
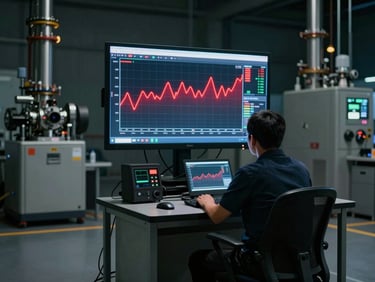
02 — Adquisición continua

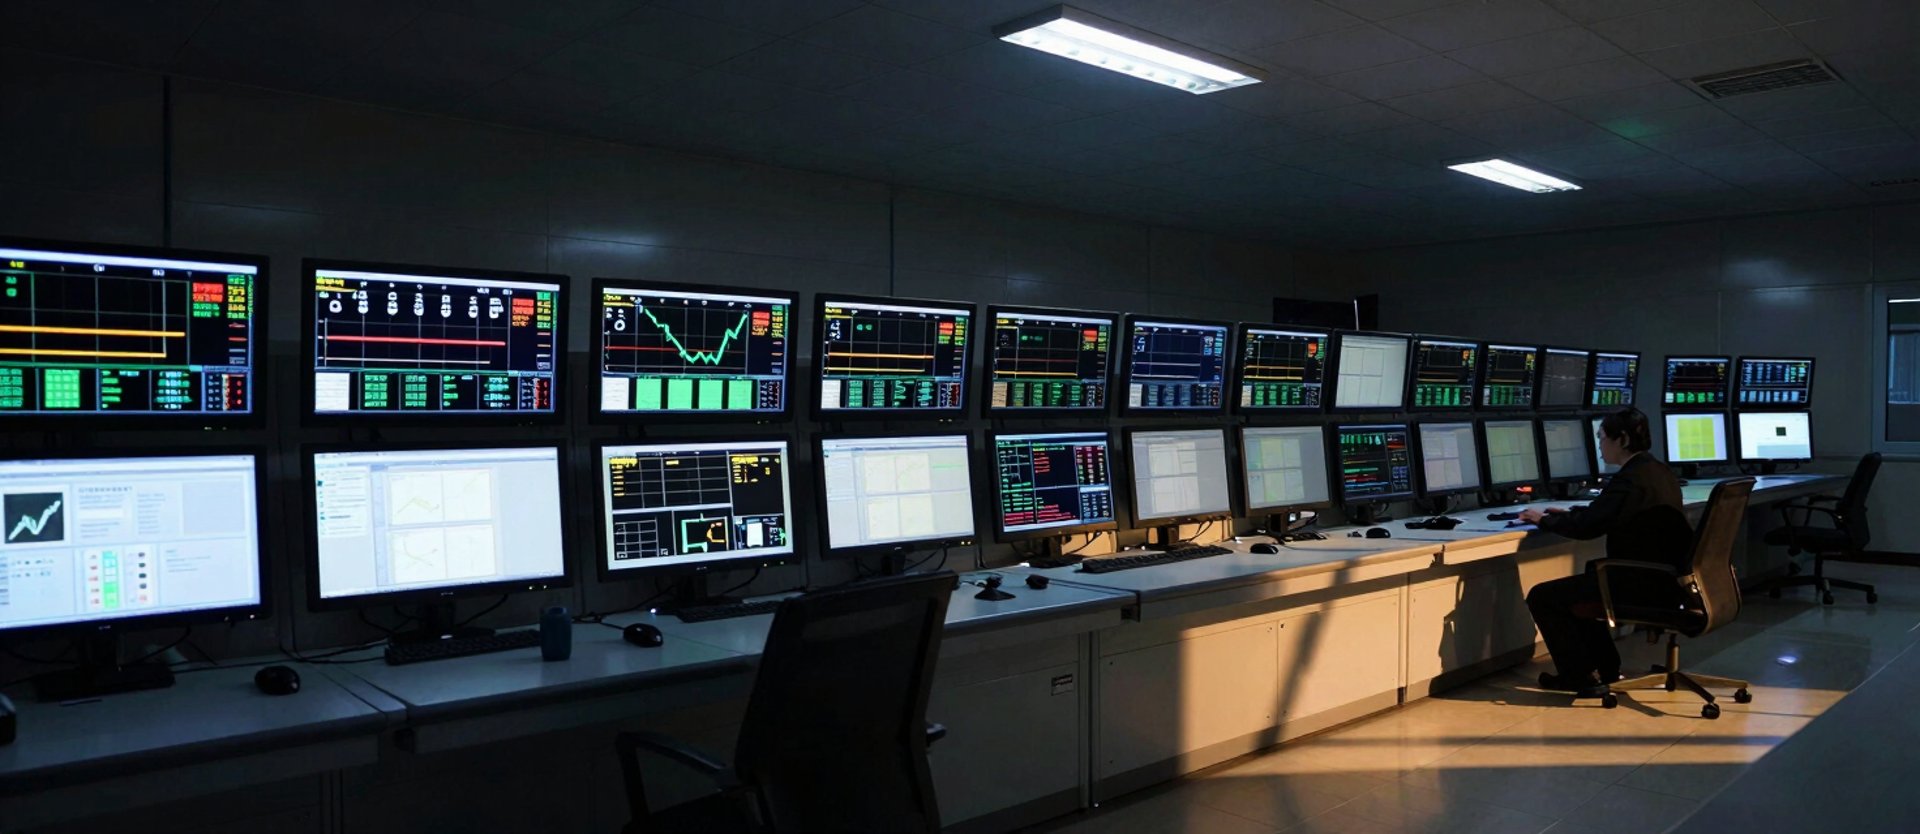
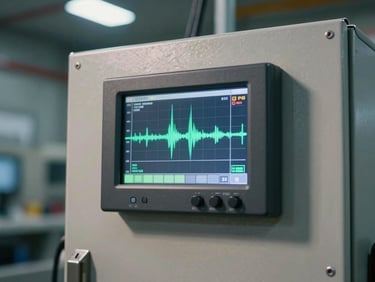
03 — Análisis e interpretación

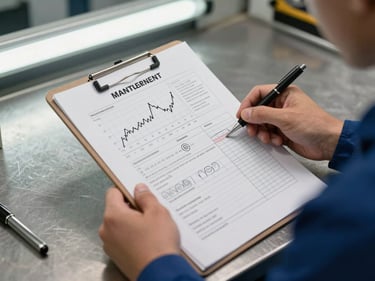
04 — Alerta con tiempo de acción

Nuestros técnicos instalan sensores calibrados directamente en el equipo. Cada punto de medición se documenta con el historial específico de la máquina.

Los datos fluyen de forma continua hacia nuestra plataforma. Nada se muestrea al azar: cada lectura queda fechada y vinculada al equipo correspondiente.

Nuestros ingenieros cruzan las lecturas con el historial del equipo. Las anomalías se contextualizan antes de generar cualquier alerta — sin falsas alarmas.

Su equipo recibe una alerta detallada con el componente en riesgo, el margen de tiempo estimado y la acción recomendada. Nada ambiguo.

Extreme close-up of an analog pressure gauge mid-reading, needle resting just below the red zone, worn steel housing with paint chips and grease marks, hard side light from a factory window cutting across the dial face
▸ Anticipación basada en datos

Tres semanas antes de la falla

Nuestro promedio de anticipación es de 21 días antes de que un componente falle. Ese margen no viene de un modelo genérico — viene de los registros históricos de su equipo específico.

Su equipo de mantenimiento conserva la decisión final. Nosotros ponemos los datos sobre la mesa: tendencia, velocidad de deterioro y ventana de intervención recomendada.

Cada alerta incluye el componente identificado, la variable fuera de rango y el historial de lecturas que respalda el diagnóstico.

¿Cómo funciona en su planta?

Cada instalación empieza con un diagnóstico de su equipo actual. Hablemos de su proceso específico y construyamos el plan de monitoreo desde ahí.